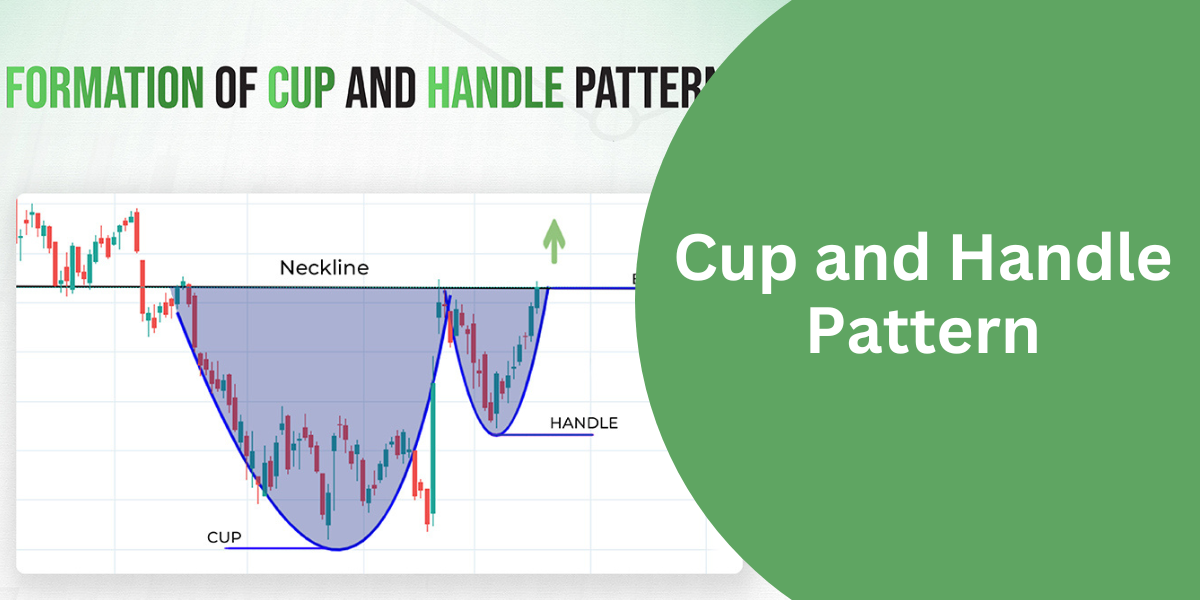
The cup and handle chart pattern is the most commonly recognized among technical analysts. It presents a possible continuation of upward price movements to the buyers. The pattern’s characteristic shape and the high degree of effectiveness in which it works with the price have made it extremely popular.
What is the Cup and Handle Pattern?
The Cup and Handle is a technical analysis chart pattern resembling a tea cup. It consists of two parts: the cup, which is the rounded “U”-shaped bottom that indicates consolidation, and the handle, which is a smaller dip signaling a pause before a breakout. This pattern suggests a shift from sellers to buyers and is used commonly across markets such as stocks, commodities, and forex for the prediction of price increases.
Key Features of the Cup and Handle Pattern
Below are the essential characteristics of the cup and handle pattern:
| Feature | Description |
| Cup Formation | A U-shaped curve indicating a consolidation phase with a gradual recovery. |
| Handle Formation | A small dip or sideways movement after the cup, indicating slight hesitation. |
| Breakout Point | The point where the price surpasses the resistance line formed by the handle. |
| Duration | The cup forms over weeks or months, while the handle lasts a few days to weeks. |
| Volume Trends | Volume typically declines in the handle and then increases abruptly at the breakout. |
Steps to Identify the Cup and Handle Pattern
- Spot the Cup: Identify a U-shaped curve on the price chart. It should be rounded at the bottom, not V-shaped.
- Look for the Handle: Following the cup, look for a small downward movement or consolidation. This is the handle.
- Identify the Resistance: Draw a resistance line across the top of the cup.
- Wait for the Breakout: Wait for the price to move above the resistance line with increased volume.
How to Trade Using the Cup and Handle Pattern
Steps involved in the cup and handle trading pattern to trade successfully
- Identify the Pattern: Get a clear-cut Cup & Handle formation on the chart
- Measure the Cup Depth: Obtain the depth of the cup to predict how much prices might move.
- Place an Entry Order: When prices break the resistance line with strong volumes, place an entry order.
- Set a Stop-Loss: Place a stop-loss just below the point of the handle to minimize losses.
- Determine a Target Price: Take the depth of the cup and add it onto the breakout price.
Example of the Cup and Handle Pattern
The Cup and Handle pattern follows distinct phases, each signaling a potential price movement. Here’s a breakdown of its appearance on a chart:
| Phase | Description | Appearance of a Chart Pattern |
| Cup | Price falls and steadily recovers. | Round-U shape at the bottom |
| Handle | A small fold after the recovery | Little downward slope or horizontal line |
| Breakout | Price climbs above the resistance level. | Sharp upward movement. |
Benefits of the Cup and Handle Pattern
The Cup & Handle formation offers several advantages that make it a reliable tool for traders in analyzing market trends.
| Advantage | Explanation |
| Strong Signals | It has clear entry and exit points. |
| Flexible Application | Can be used in various markets and timeframes. |
| Consistent Pattern | Usually leads to significant price action after a breakout. |
| Helps in Risk Management | Traders can have logical stop-loss levels. |
Limitations of the Cup and Handle Pattern
While effective, this pattern has its limitations:
- False Breakouts: The breakout may sometimes fail. This leads to losses.
- Time-Consuming: The formation of a cup may take even several weeks or months.
- Confirmation: Volume and other indicators must confirm the breakout.
Tips for Trading the Cup and Handle Pattern
- We use multiple indicators like moving averages and RSI for confirmation.
- Concentrate on patterns forming after an uptrend for higher reliability.
- Monitor trading volume closely during the breakout phase.
- Most importantly, avoid trading patterns that deviate significantly from the classic cup and handle shape.
Differences Between Bullish and Bearish Cup and Handle
The Cup & Handle formation can appear in both bullish and bearish scenarios, with key differences in their formation and breakout direction.
| Aspect | Bullish Cup and Handle | Bearish Cup and Handle |
| Trend Before Formation | Uptrend | Downtrend |
| Breakout Direction | Upward | Downward |
| Market Sentiment | Bullish | Bearish |
Practical Applications of the Cup & Handle formation
- Stock Market: This pattern is often applied by traders to identify buying opportunities in stocks that have long-term growth potential.
- Forex Trading: The Cup & Handle formation helps one spot trends in currency pairs when there is a strong uptrend.
- Commodities: This pattern helps in predicting price movements for commodities like gold or oil.
Conclusion
The cup and handle pattern represents a powerful tool for traders searching for bullish trends to cash in on. Its structural clarity and reliable breakout signal make it an important item in technical analysis. Knowledge of its formation, strategies, and limitations will facilitate the incorporation of this pattern into your trading practice.
Read More Blogs:
Quit Claim Deed: Understanding Its Role in Property Transfers


